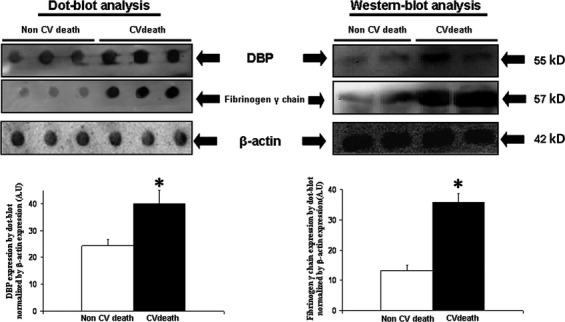
Figure 3.

On the upper left side is shown a representative dot-blot to determine plasma vitamin D-binding protein (DBP) and fibrinogen-γ-chain expression in participants with and without cardiovascular death during follow-up. In the images is also shown representatives expression of β-actin in plasma that was used as loading protein control and for to normalize the densitometric analysis in dot-blots. The bar graphs show the densitometric analysis of all dot-blots in arbitrary units (A.U.). Densitometric values were normalysed by plasma β-actin expression and are represented as mean ± SEM. *P < 0.05 with respect to participants with non-cardiovascular death during follow-up. On the upper right side is shown a representative Western-blot showing single bands of 55 and 57 kD of apparent molecular weights corresponding to DBP and fibrinogen-γ-chain respectively.
