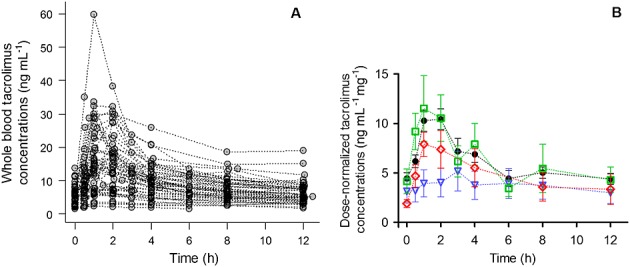
Figure 1.

Time course of whole blood tacrolimus concentrations. A) concentration–time curves of 53 Mexican paediatric renal transplant recipients and B) mean and SE of dose-normalized concentration-time curves.  = Prograf®,
  = Limustin®,
  = Framebin®,
  = Tenacrine®. In panel B data from patients with unknown tacrolimus formulations were omitted
