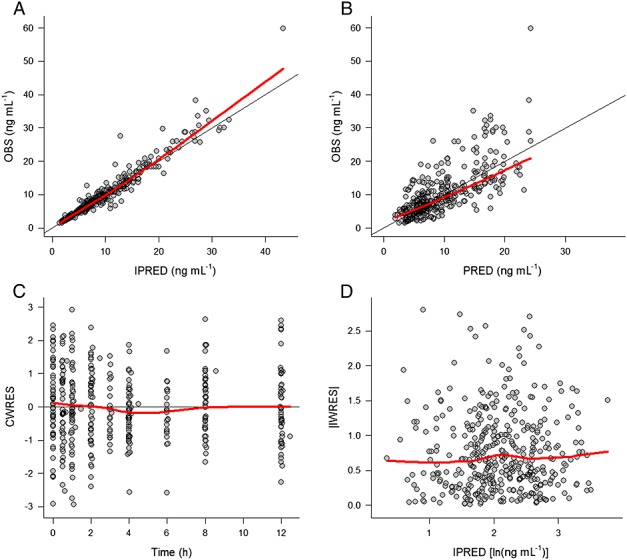
Figure 2.

Goodness of fit plots corresponding to the final population PK model. PRED and IPRED, typical and individual model predictions, respectively; OBS, observation; CWRES, conditional weighted residuals, IWRES, individual weighted residuals. Black solid lines indicate perfect fit, red solid lines show a smooth (loess) through the data
