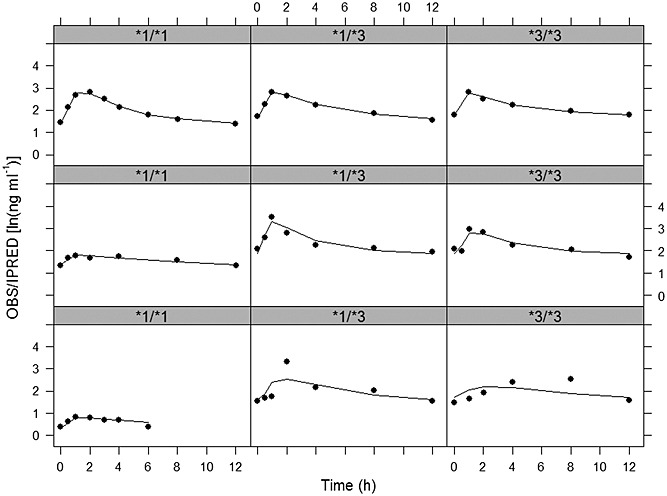
Figure 3.

Individual observed (circles) and model predicted (solid lines) tacrolimus concentrations vs. time profiles for the best (upper panels), median (middle panels) and worst (lower panels) fitted patients in the studied population for the CYP3A5 *1/*1 (first column), *1/*3 (second column) and *3/*3 (third column) genotype
