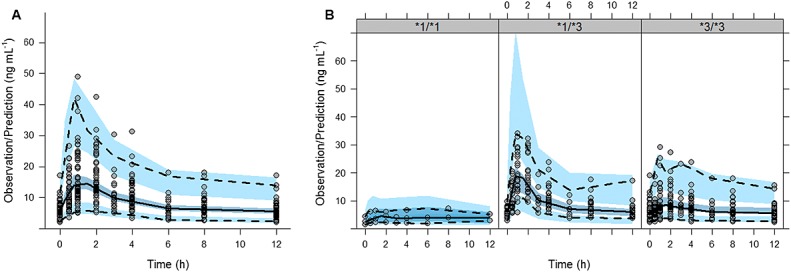
Figure 5.

Evaluation of the final model using a prediction-corrected visual predictive check. A) entire population, B) stratified by genotype. Comparison between the observed whole blood tacrolimus concentrations (circles) and the 2.5th (bottom dotted line) 50th (solid line) and 97.5th (top dotted line) percentiles of the raw data, with the 2.5th, 50th, and 97.5th prediction intervals (blue areas) of the corresponding percentiles obtained from 1000 simulated datasets
