
Figure 2.
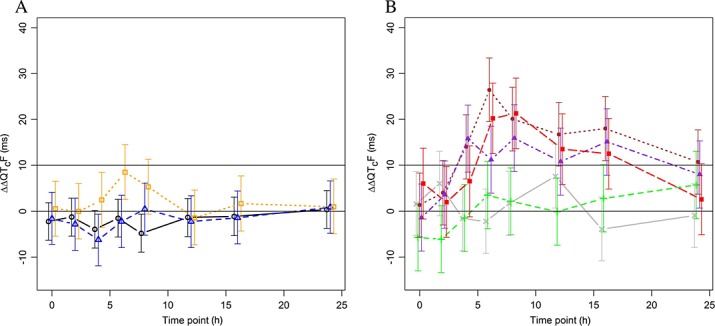
Placebo-adjusted, change from time matched baseline QTcF (ΔΔQTcF; mean ± 90%CI). Results are based on an analysis of variance model for repeated measurements with terms for dose level, time point and their interaction. A) Period 1 (OZ439 only). Number of subjects: 24, eight and seven subjects in the 100 mg, 300 mg and 800 mg groups, respectively.  800 mg OZ439,
  300 mg OZ439,
  100 mg OZ439. B) Period 2 (OZ439 + PQP). Number of subjects: eight subjects in 100 mg OZ439 + 160 mg PQP and 100 mg OZ439 + 1440 mg PQP, seven subjects in 100 mg OZ439 + 480 mg PQP and 300 mg OZ439 + 1440 mg PQP and six subjects in 800 mg OZ439 + 1440 mg PQP groups.
  800 mg OZ439 + 1440 mg PQP,
  300 mg OZ439 +1440 mg PQP,
  100 mg OZ439 +1440 mg PQP,
  100 mg OZ439 + 480 mg PQP,
  100 mg OZ439 + 160 mg PQP