
Figure 3.
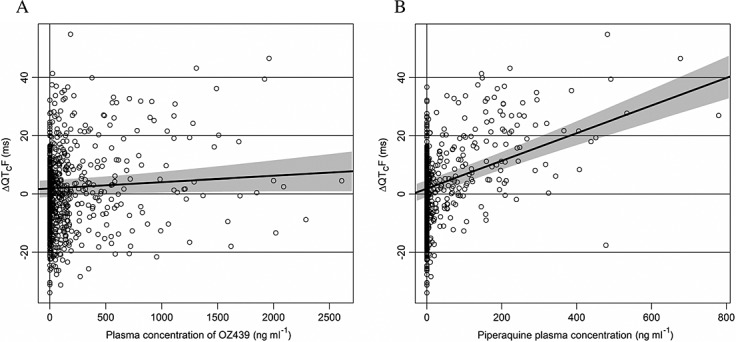
Scatter plot of change from average baseline QTcF (ΔQTcF) vs. concentration of OZ439 (A) and piperaquine (B). The black lines are the predicted effect with ER analysis on ΔΔQTcF with 90% confidence intervals. These regression lines are derived from the primary model setting the effect of time and of the other drug (piperaquine for (A) and OZ for (B)) to zero. Therefore this regression lines do not necessarily go through the centre of the respective scatter plot