
Figure 2.
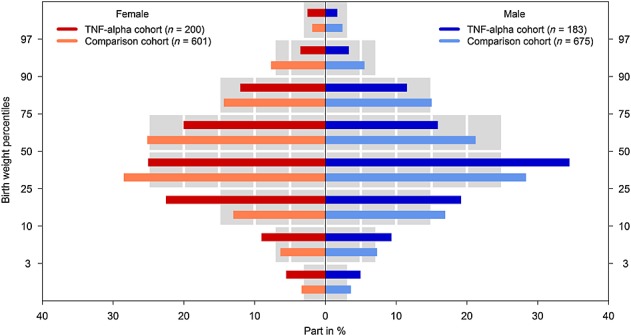
Birth weights according to centile categories and sex by cohort. Coloured bars give the proportions of singletons of both study cohorts according to centile categories. Grey bars represent the proportion of new-borns from the German perinatal survey 29. (The differences in numbers of infants compared with Table4 are due to missing values in the gestational week at delivery, sex of the infant or birth weight)