
Figure 3.
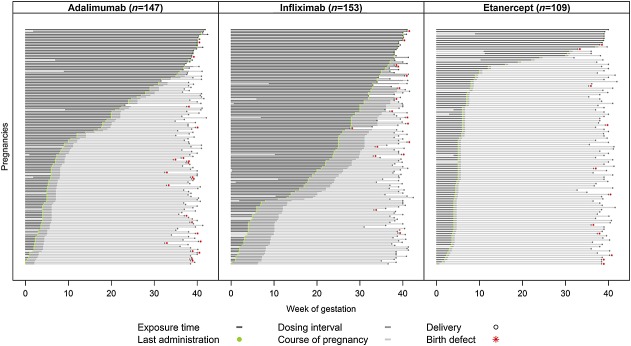
Duration of prenatal ADA, IFX or ETA exposure in live-born infants. Each pregnancy is represented by a single line, showing assumed fetal exposure times, i.e. treatment duration plus 1 dosing interval. The differences in exposure times among the three TNF-α-inhibitors are obvious