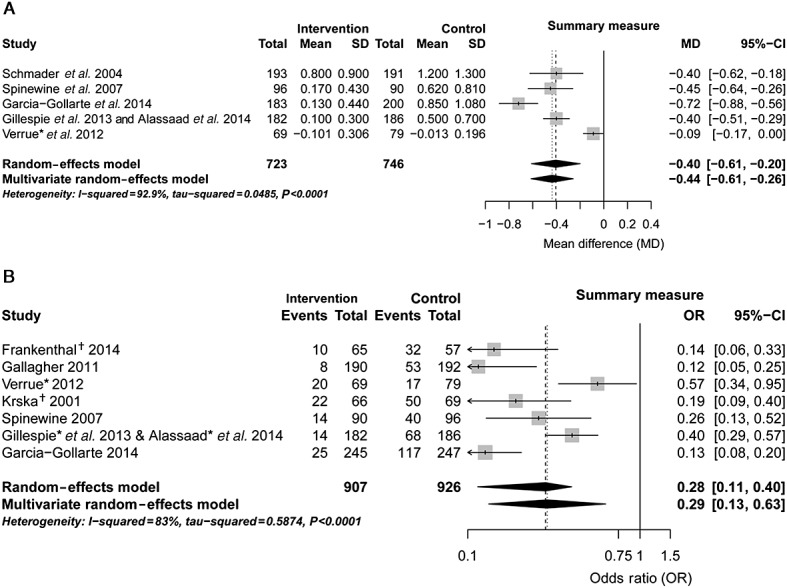
Figure 2.

Forest plots of intervention effects on the continuous mean of omitted drugs per patient (A) and the proportion of patients with ≥1 omission (B). (* mean changes from baseline or Mantel–Haenszel odds ratio were calculated, accounting for baseline imbalances; † number of potential prescribing omissions (PPOs) was used instead of number of patients unavailable). CI, confidence interval
