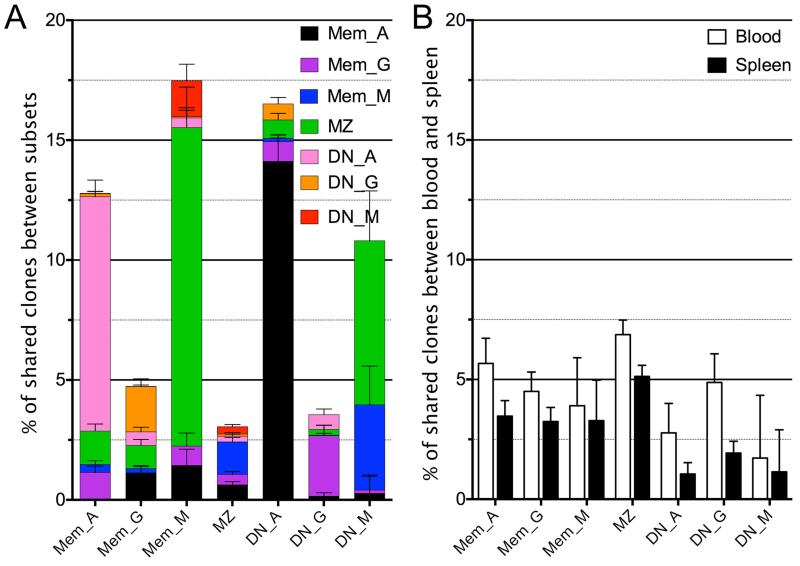
Figure 3. Clonal relationships between subsets and tissues.
(A) Percentage of clones shared between B cell subsets, analyzed for each individual subset and color-coded for the subset sharing these clones. (B) Percentage of clones showing clonal relationships between blood and spleen for the same subset among blood cells (white) and spleen cells (black). The error bars represent the binomial proportion confidence interval (95%). Clonal relationships were analyzed for each donor separately, and the total number of clones belonging to the same category (e.g. clones shared between blood and spleen Mem_A subsets) were pooled from the three donors and reported to the total number of clones obtained in the corresponding subset for the three samples (e.g., total clones from blood Mem_A or spleen Mem_A subsets, first two columns, panel B).

