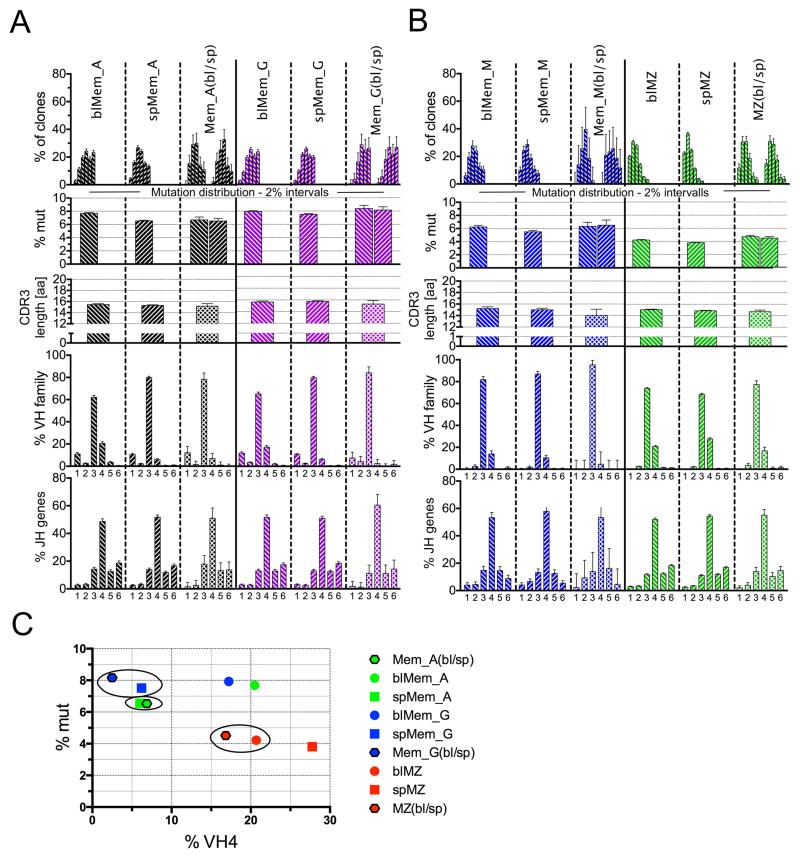
Figure 6. Repertoire profile of clones shared between blood and spleen.
Analysis of clones shared between blood and spleen for IgG and IgA (A), and IgM subsets (B). Abbreviations and criteria of repertoire analysis are depicted in legend to Figure 5 with the addition of tissue: blood (bl) and spleen (sp). (C) 2D plot representation according to mutation frequency and Vh4 usage of the clones shared between blood and spleen for Mem_G (blue), Mem_A (green) and MZ (red) B cells, together with the profile of the parental blood and spleen subsets. Spleen sequences are represented by squares, blood sequences by dots, and sequences shared between blood and spleen by a hexagon framed in black. Circles mark the closest parental subset of the clones shared between both tissues.

