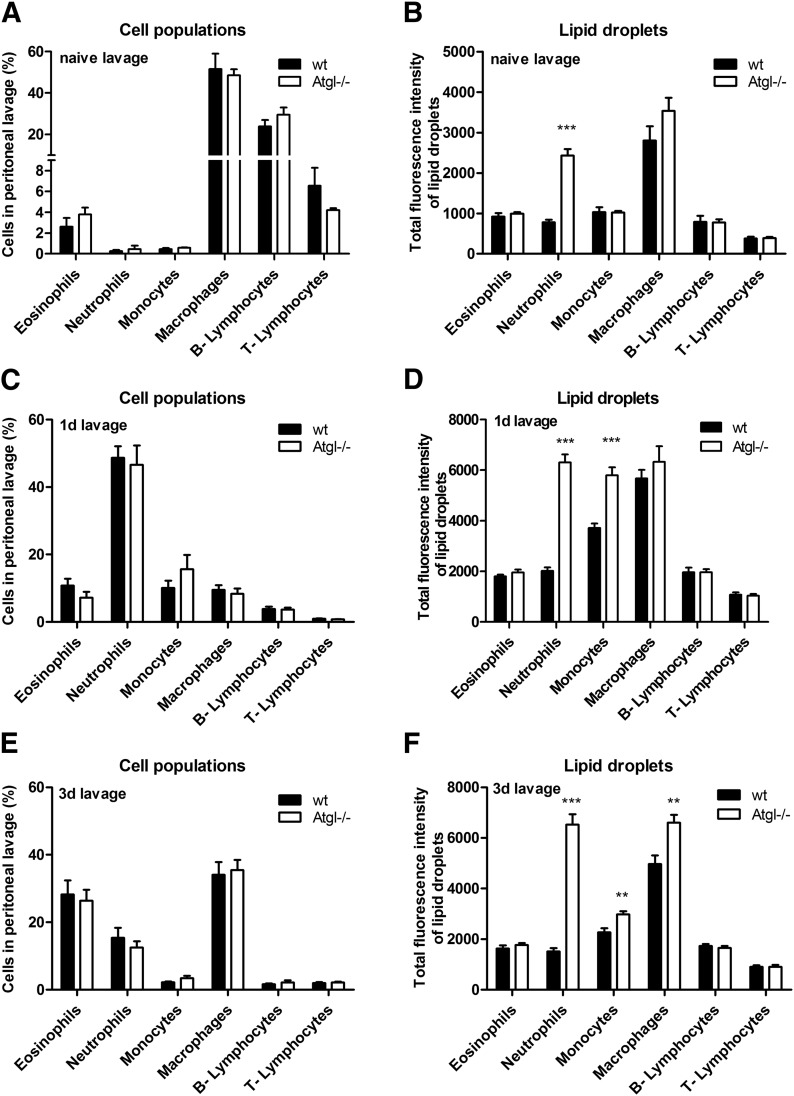
Figure 2. Pronounced accumulation of LDs in Atgl−/− cells under inflammatory conditions.
Peritoneal lavage of naive (A and B), 1 d (C and D), and 3 d (E and F) thioglycolate-injected WT and Atgl−/− mice was collected and immunophenotyped by use of BODIPY 493/503 as a neutral lipid stain. Data are shown as geometric means of fluorescence intensity + sem (n = 5). **P ≤ 0.01; ***P ≤ 0.001.

