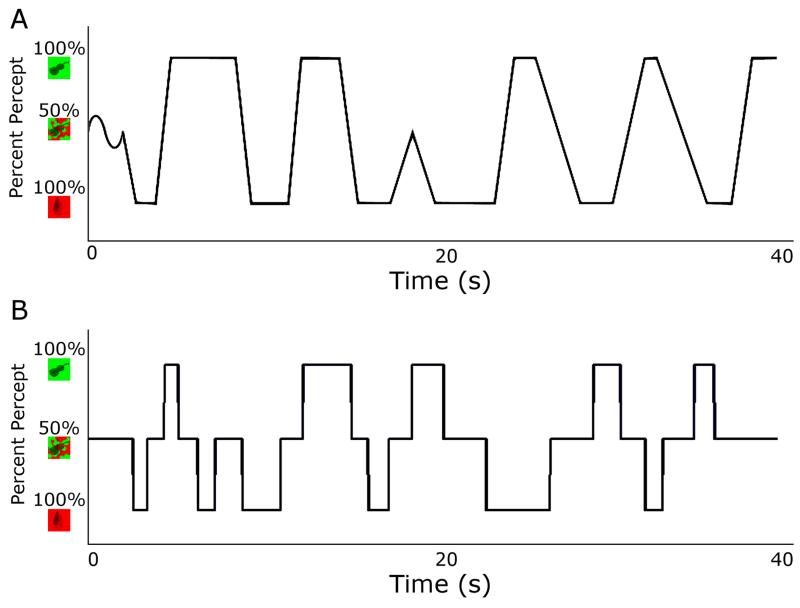
Figure 2. Example time courses of control experiment stimulus presentation.
A. Smooth, linear transitions between images, designed to measure participants’ response criteria to judge the boundary between a mixed and dominant image. Stimuli simulated natural rivalry, starting with a mixed image (Object Condition: 50% green/red; Grating Condition: 50% 45°/−45°) and thereafter smoothly oscillating between the two percepts (Object Condition: 100% green or 100% red; Grating Condition: 100% 45° or 100% −45°). B. Sudden transitions between images, designed to measure participants’ motor latencies to report the onset of a mixed or dominant image. Trials began with a mixed image, after which stimuli abruptly alternated between three states (Object Condition: 100% green, 100% red, and 50% red/green; Grating Condition: 100% 45°, 100% −45°, and 50% 45°/−45°).

