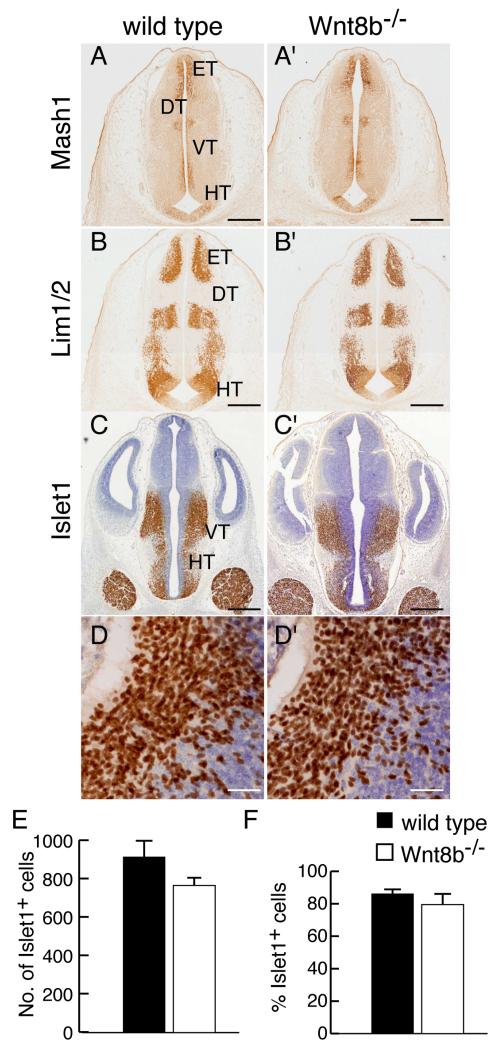
Figure 4. Normal expression of hypothalamus markers in Wnt8b−/− mutants.
(A-D’) Immunoreactivity for Mash1 (A,A’), Lim1 (B,B’) and Islet1 (CD’) in coronal sections of diencephalon in E12.5 wild type (A-D) and Wnt8b−/−embryos (A’-D’). D,D’ show high magnification views of Islet1 immunoreactivity in the hypothalamus, as used for cell counting. (E,F) Graphs showing number (E) and percentage (F) of Islet1 expressing cells in the hypothalamic region of E12.5 embryos, as estimated by counting in 212.5 × 212.5 μm areas of representative sections. Bars represent mean ± SEM; n=3 per genotype. Scale bars: A-C’ 400 μm; D,D’ 50 μm. Abbreviations: DT: dorsal thalamus; ET: epithalamus; HT: hypothalamus; VT: ventral thalamus.

