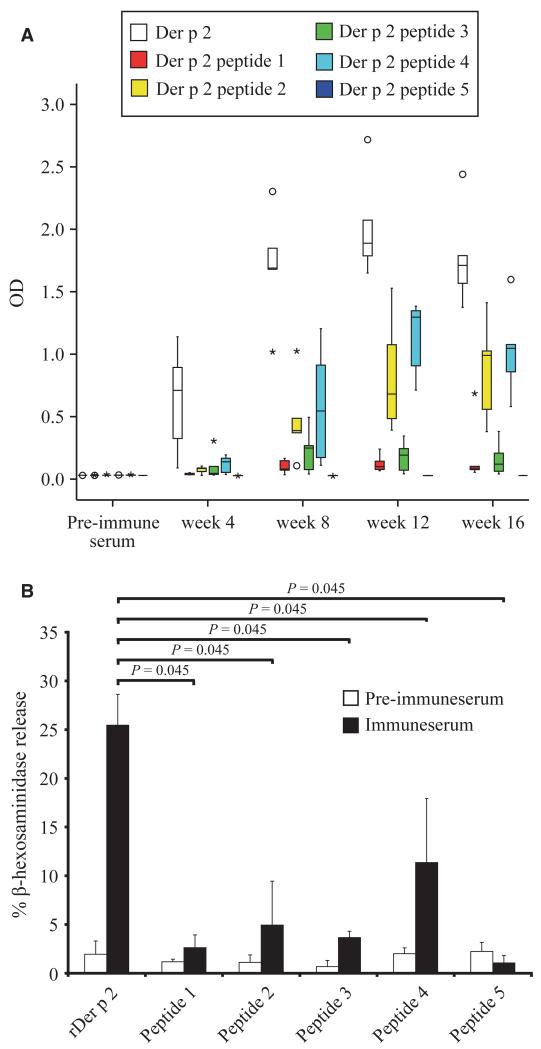
Figure 5.
(A) Der p 2-specific IgG1 responses of mice immunized with rDer p 2 or Der p 2 peptides. Groups of five mice each were immunized with rDer p 2 or Der p 2 peptides in 4-week intervals. The optical densities (OD 405 nm) corresponding to the IgG1 antibody levels (y-axis) are displayed for groups of five mice as box plot diagram where 50% of the values are within the boxes and nonoutliers between the bars. Lines within the boxes indicate the median values. Open circles and stars indicate outliers and extreme values of each mouse group. (B) Der p 2-specific basophil degranulation of rat basophil leukemia (RBL) cells loaded with sera from mice immunized with rDer p 2 or Der p 2 peptides. Rat basophil leukemia cells were loaded with serum IgE from mice obtained before (pre-immune serum) or after immunization (immune serum) with Der p 2 or Der p 2 peptides 1–5. Der p 2-specific release of β-hexosaminidase is displayed as percentage of total release on the y-axis. Results are displayed as mean values ± SD from each mouse group. Statistically significant differences are indicated.

