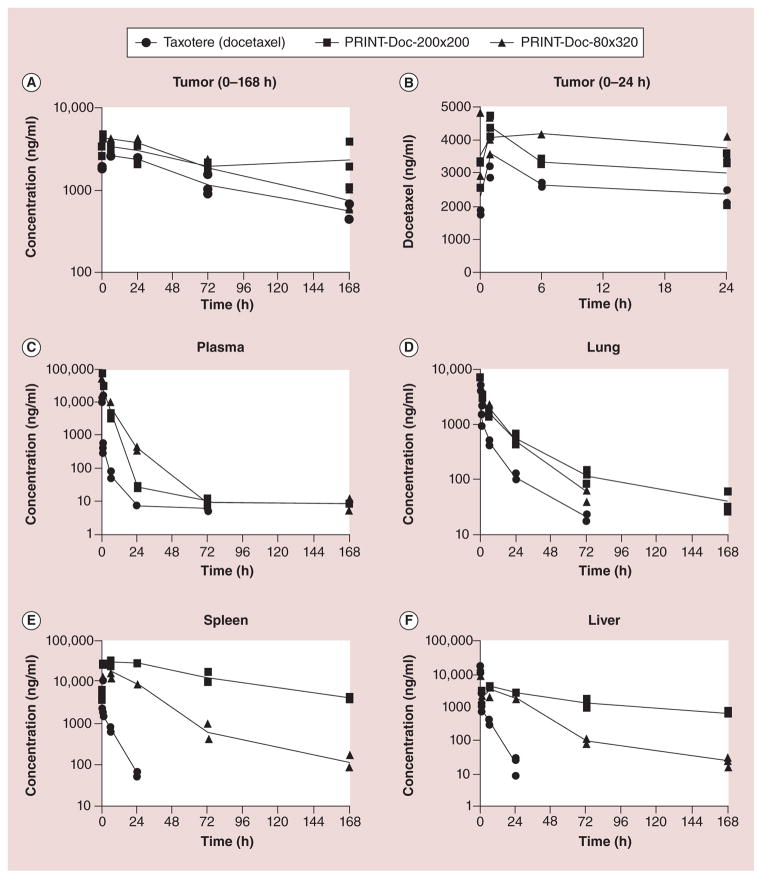
Figure 4. Plasma and tumor doectaxel vs time curves in mice bearing SKOV3 ovarian flank xenografts after administration of three different docetaxel formulations.
(A) Tumor (0–168 h), (B) tumor (0–24 h), (C) plasma, (D) lung, (E) spleen and (F) liver. Doc concentration values for each mouse are represented in the key. The lines are connected by the mean value for each time point.
Reproduced with permission from [37].

