
Figure 6. Relationship between phagocytosis in monocytes/dendritic cells from blood and clearance of PEGylated liposomal agents in mice, rats, dogs and patients.
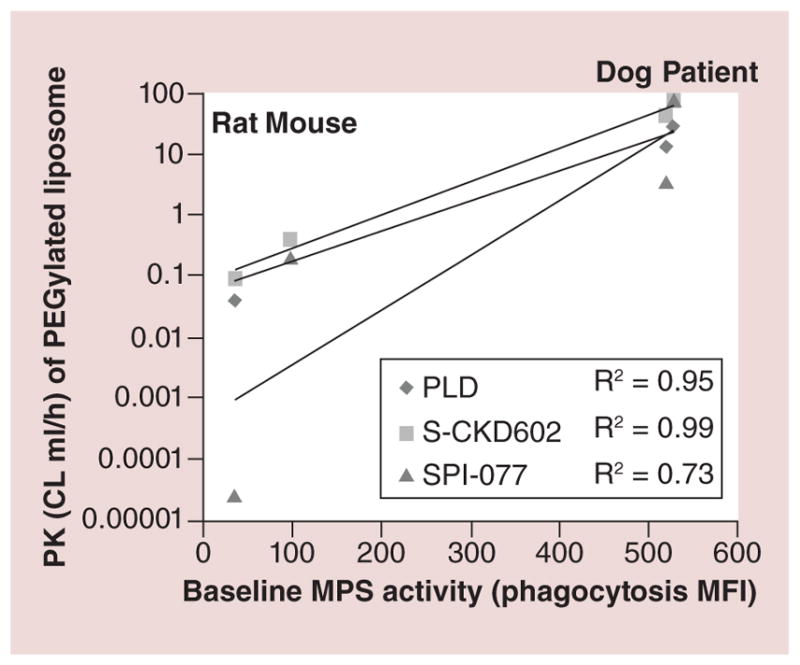
The mean values for three species are represented by individual symbols, with diamonds as PLD, squares as S-CKD602 and triangles as SPI-077. The species data are in vertical columns from left to right: rats, mice, dogs and patients. The best fit line for each group is represented by the solid lines. Across species, a positive association was observed between cell function and CL of PEGylated liposomes.
CL: Clearance; MFI: Mean fluorescent intensity; MPS: Mononuclear phagocyte system; PK: Pharmacokinetics; PLD: PEGylated liposomal doxorubicin; R2: Coefficient of determination.
Adapted with permission from [44].