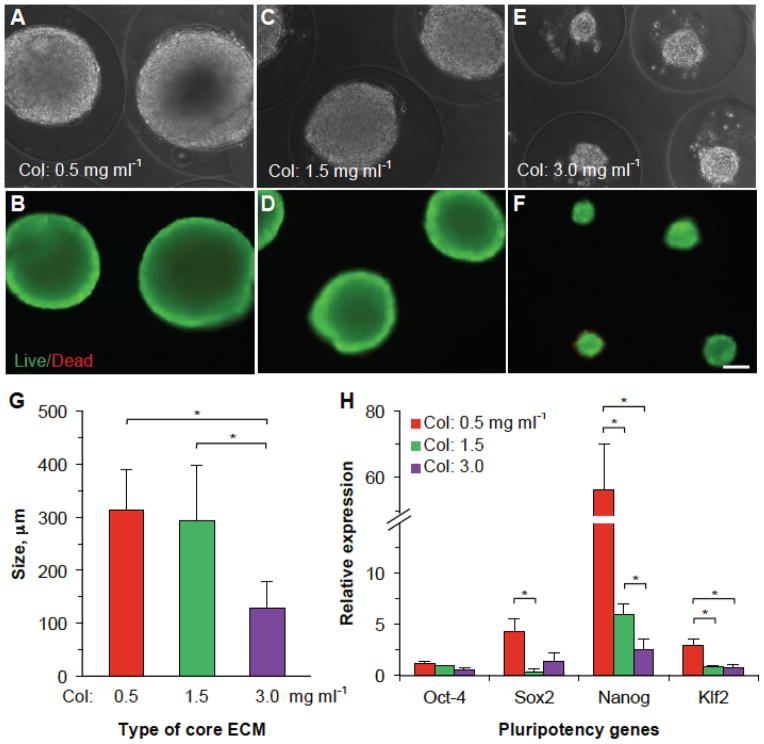
Figure 3.
Proliferation of encapsulated mESCs in different collagen core ECMs with varying structural and mechanical properties. (A–F) Phase contrast and fluorescence (live/dead) images of the mESC aggregates on day 10 in different core ECMs. Massive aggregates were formed in softer core ECM with low collagen (0.5–1.5 mg ml−1) compared to significantly smaller aggregates in more rigid core with high collagen (3.0 mg ml−1). (G) Quantitative data of the size of aggregates formed in microcapsules with different core ECMs. (H) Quantitative RT-PCR data showing expression of pluripotency gene markers in the aggregated mESCs obtained from different core ECMs on day 10. Col: collagen. Alg: alginate. * denotes p < 0.05. Scale bar: 100 μm.

