
Fig. 4.
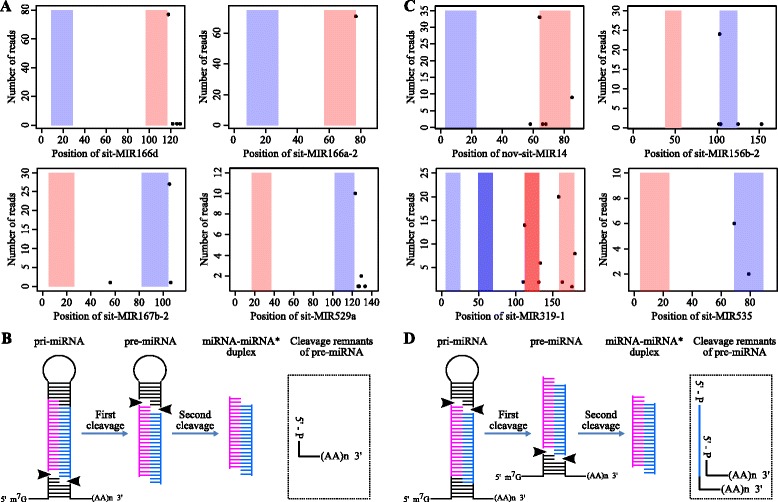
PARE tags mapping to foxtail millet miRNA hairpins. a and c Examples of “loop-last” (a) and “loop-first” (c) miRNA precursor processing. b and d A diagram of “loop-last” (b) and “loop-first” (d) processing. Regions within the pink and blue bars in (a) and (c) indicate the positions of the miRNA and miRNA* in the precursor, respectively. Two distinct miRNA/miRNA* duplexes were generated from sit-MIR319-1 and the two darker bars in sit-MIR319-1 indicate the miRNA/miRNA* duplexes of nov-sit-miR149. The read count at each position is indicated as a scatter plot