
Figure 5.
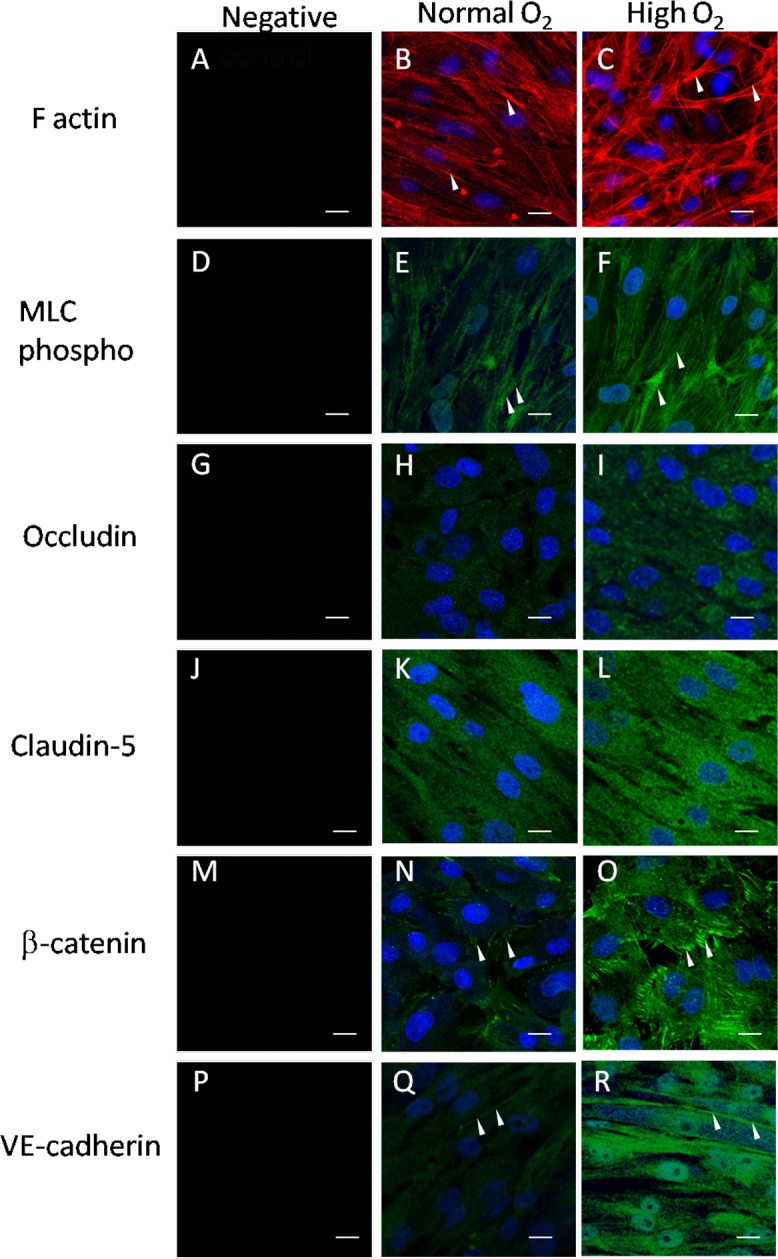
Expression of cytoskeletal and cell–cell adhesion proteins by AAP cells monitored by immunofluorescence microscopy. The expression of F-actin (A–C), myosin light chain phospho (D–F), occludin (G–I), claudin-5 (J–L), and β-catenin (M–O), VE-cadherin (P–R) appeared higher in high oxygen group compared with normal oxygen group. Background labeling was monitored via omission of primary antibody and DAPI (first column). Shown are representative images of one experiment of six in total. All the images are shown at the same magnification, gain, and offset settings. At the site of cell–cell contact, we also observed increased expression of F-actin, β-catenin, and VE-cadherin as indicated by arrowheads. Scale bar: 10 μm.