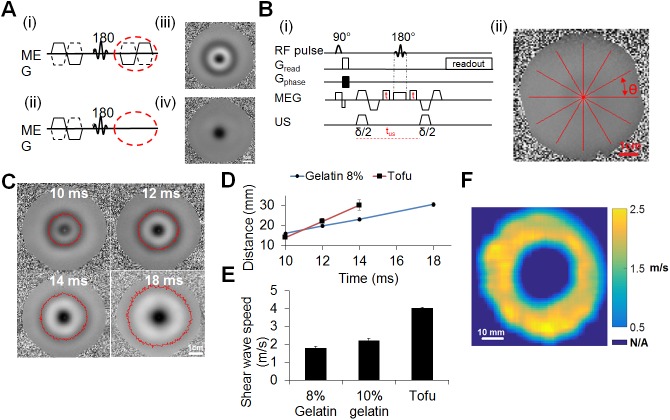
Fig 7. Shear wave visualization.
(A) Effect of the second Motion Encoding Gradient (MEG) on the phase images. TE = 23.8 ms, δ = 7 ms, Ge = 140 mT/m. The images are 85 × 85 mm2 in size. MR sequences (i,ii) and (iii,iv) the corresponding phase images of the shear wave. (B) Shear wave velocity estimation. (i). MR sequence used to estimate shear wave speed by varying delay t. (ii). Shear profiles analysis. Lines are extended from the focus outwards in all directions (360 degree sweep, at θ = 1 degree increment) to determine the distance of the peak minima from the focus. Propagation speed of the shear wave was calculated by measuring the radii of the peak and minima as a function of the delay time. (C) Shear wave propagation in 8% gelatin phantom. Phase images at shear wave propagation times of 10, 12, 14 and 18 ms corresponding to time delays t = 0, 1, 2 and 4 ms. (D) Distance of the peak minima from the focus versus delay time t in 8% gelatin and tofu phantoms. (E) Shear wave velocity in 8, 10% gelatin and tofu phantoms. (F) Shear wave velocity map.

