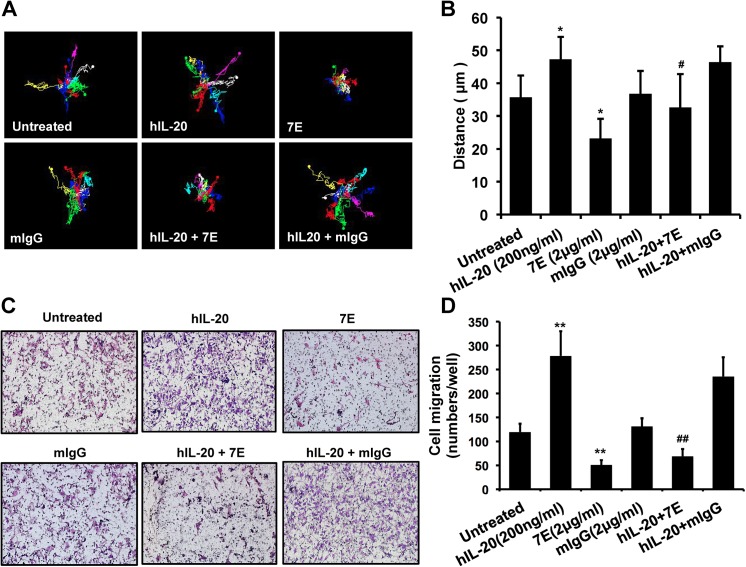
Fig 3. Cell migration was promoted in IL-20-treated PC–3 cells.
(A-B) Cell migration was evaluated using real-time migration assay. PC–3 cells were incubated with medium containing hIL–20 (200 ng/ml), 7E (2 μg/ml), mIgG (2 μg/ml), hIL–20 plus 7E, or hIL–20 plus mIgG. Cell migration kinetics was recorded using a smart fluorescent cell analyzer for 18 hours. (A) Representative time-lapse images for tracking motion distance of PC–3 cells are shown for each group. The motion distance of each cell is presented in different colors (count = 7 cells). (B) Quantization of the motion distance (in μm) of PC–3 cells (count = 7 cells). Mouse IgG was the negative control of 7E. *p < 0.05 versus untreated controls, #p < 0.05 versus the hIL–20 group. Data are the means ± SD of three independent experiments, each done in quadruplicate. (C-D) Cell migration was also evaluated using a modified Boyden chamber assay. The upper wells were loaded with 5×10⁴ PC–3 cells. The lower chambers were filled with hIL–20 (200 ng/ml), 7E (2 μg/ml), mIgG (2 μg/ml), hIL–20 plus 7E, or hIL–20 plus mIgG in RPMI–1640 containing 1% FBS. RPMI–1640 with 1% FBS was used as a negative control. The cells were allowed to migrate for 8 hours. (C) Representative Giemsa staining photos are shown for each group. (D) Quantitation of migrated cells per well. **p < 0.01 versus untreated controls. ##p < 0.01 versus the hIL–20 group. Data are the means ± SD of three independent experiments, each done in quadruplicate.

