
Fig. 6.
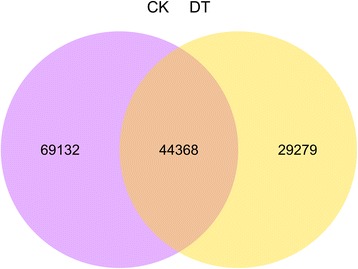
The Venn diagram of the specific genes under the drought stress. The Venn diagram showing the number of specific genes between the two treatments
Official websites use .gov
A
.gov website belongs to an official
government organization in the United States.
Secure .gov websites use HTTPS
A lock (
) or https:// means you've safely
connected to the .gov website. Share sensitive
information only on official, secure websites.
The Venn diagram of the specific genes under the drought stress. The Venn diagram showing the number of specific genes between the two treatments