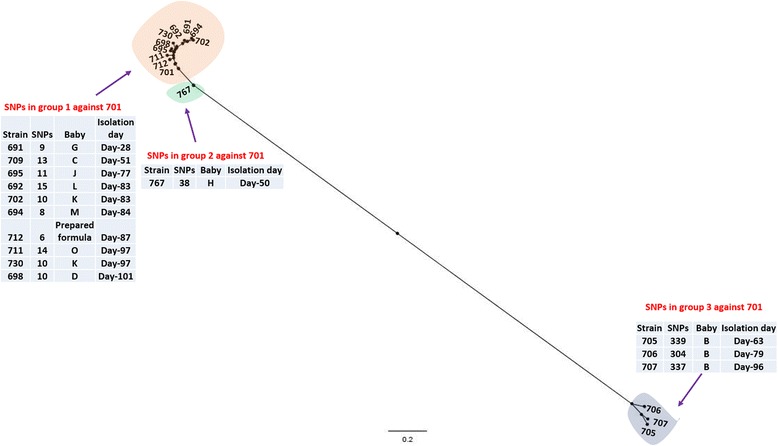
Fig. 3.

2SNP phylogeny of the cluster 2 strains. The SNPs calls were obtained using SMALT and SAMtools to generate the VCF files which were filtered using VCFTools to include only SNPs with minimum quality score of 30, minimum depth of 8, and minimum allele frequency of 0.90. The SNPs in the cluster were concatenated and used to create a maximum likelihood phylogeny. The tip labels shaded orange, green and yellow indicate groups 1, 2 and 3 respectively within cluster 2. The red tip label shows the reference strain. The tree was rooted to midpoint. The scale bar indicates the rate of nucleotide differences per sequence site
