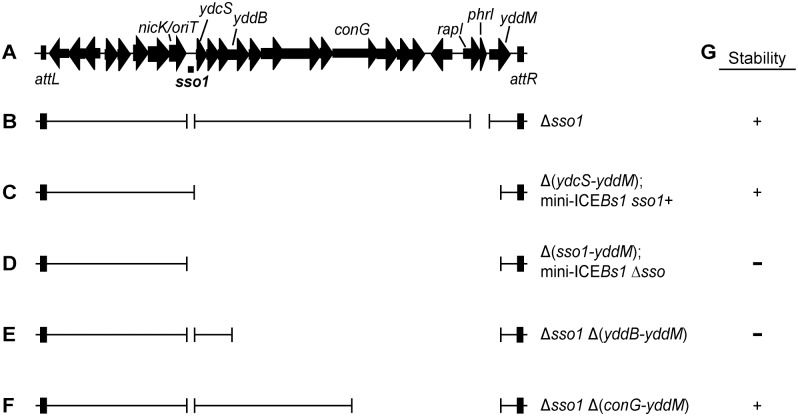
Fig 1. Map of ICEBs1 and mutants.
(A) Map of ICEBs1. A map of the genes and some of the sites in the ~20 kb ICEBs1 is shown, not precisely to scale. The location of sso1, between nicK and ydcS, is indicated underneath the map of ICEBs1. This is the ~200 bp sequence that is similar to the sso of pTA1060 (Fig 2). The 418 bp fragment that was cloned to test for sso activity extends ~100 bp upstream and downstream of the region shown. Arrows indicate open reading frames and the direction of transcription. The black rectangles at the ends of ICEBs1 represent the flanking 60 bp repeats attL and attR that contain the site-specific recombination sites required for excision of the element from the chromosome. (B-F) Schematics of ICEBs1 mutants used to test sso function. Thin lines indicate the regions of ICEBs1 present and gaps correspond to deleted regions. Except for the markerless Δsso1 allele, all deletions also contain an insertion of a kan cassette (not included in the figure). Strains containing these ICEBs1 mutants are listed in Table 1. (B) The Δsso1 markerless deletion is denoted by the gap surrounding sso1. The larger gap near the right end indicates deletion of rapI-phrI and insertion of kan (not included in the figure). (C-D) Schematics of mini-ICEBs1 mutants that are missing all genes and most sequences downstream of sso1. (C) contains sso1; (D) missing sso1. (E-F) Schematics of Δsso1 ICEBs1 mutants that are also missing sequences between yddB and yddM (E) or conG and yddM (F). Deletion endpoints are described in Materials and Methods. (G) Summary of the results from experiments measuring stability of the ICEBs1 mutants after induction in dividing host cells and in transconjugants. + indicates stable; − indicates decreased stability.

