
Fig. 6.
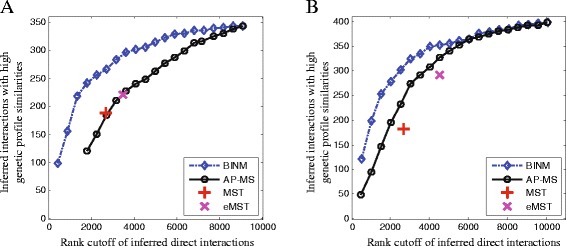
Assessment of inferred direct interactions using the genetic interaction profiles. Interactions are ranked by scores calculated using corresponding methods. Performance of all methods is measured by plotting the number of top-ranking inferred direct interactions of a method against the number of these interactions which also have high genetic profile similarities. Functional similarity of proteins is measured by Pearson’s correlation between their genetic interaction profiles, and protein pairs with functional similarities ≥0.2 are used to construct the genetic interaction reference set. a Collins dataset, b Friedel dataset