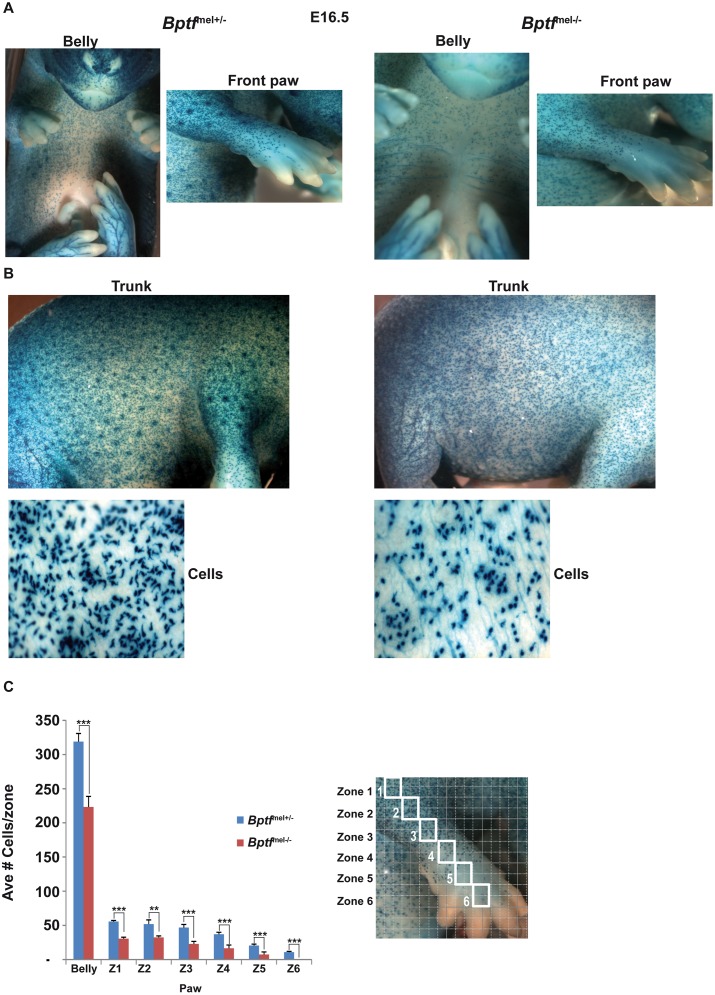
Fig 5. Diminished melanoblast proliferation in Bptf-mutant mice.
A-B. Photographs of representative Bptf mel+/- and Bptf mel-/- E16.5 foetuses in the Dct-LacZ background to identify melanoblasts. Panel A shows the ventral portion and front paw, and panel B the trunk and a zoom of representative cells from the trunk regions. C. Quantification of LacZ-labelled melanoblasts in the indicated regions. An example of the grid used is shown over the limb and paw that is divided into zones (Z). Statistical significance of the difference in cell counts between the Bptflox/+ and Bptflox/lox embryos was assessed using two-tailed, unpaired Student’s t-test (**P < 0.01; ***P < 0.001). N = 4.

