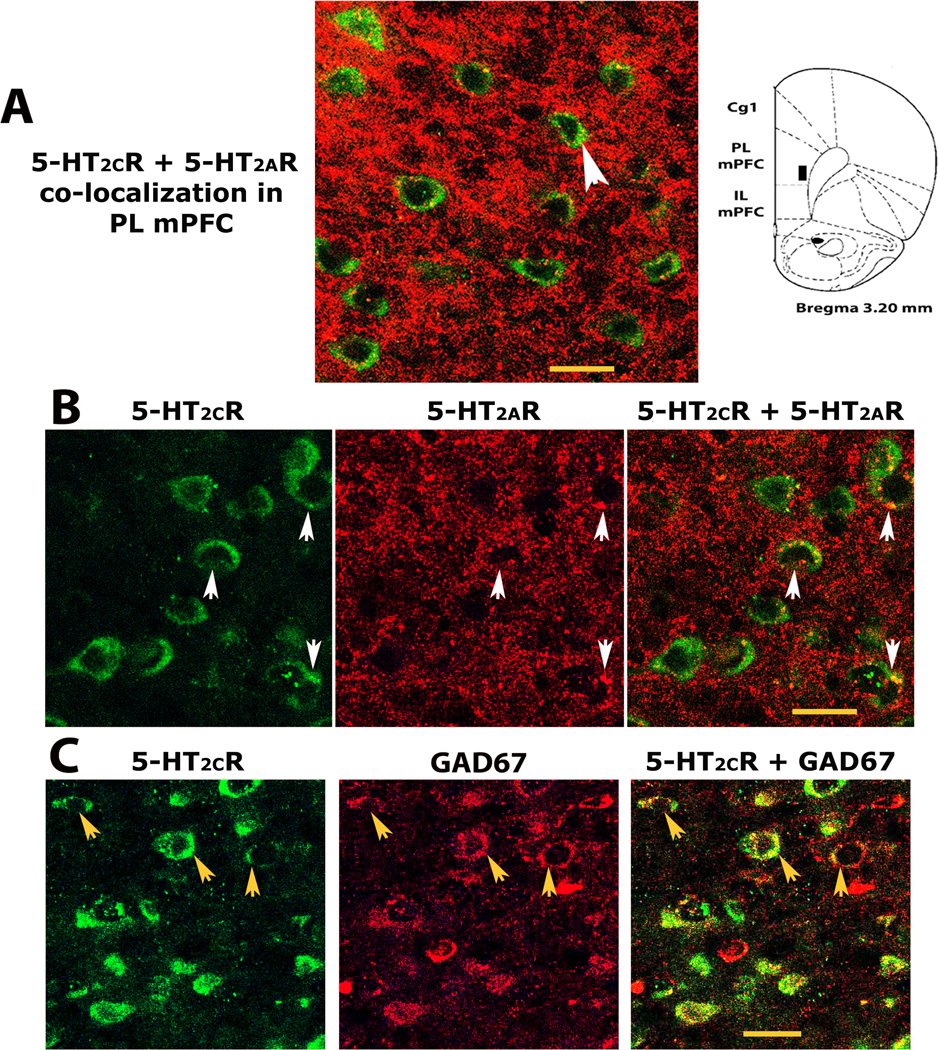
Fig5. Cells with a pyramidal shape and layered expression show 5-HT2AR and 5-HT2CR co-labeling in layer V of the prelimbic mPFC.
A. Immunofluorescent confocal images of potential pyramidal 5-HT2AR and 5-HT2CR co-labeling (see sample cell above arrowhead with green 5-HT2CR immunolabeling and yellow punctate staining around its nucleus indicative of 5-HT2AR co-expression). B. A confocal image showing a population of linearly expressed pyramidal-shaped cells in layer V of the prelimbic mPFC with green 5-HT2CR expression and punctate 5-HT2AR co-labeling around their nucleus (see arrows in the end photo). The first and middle photos show each antibody separately (see same arrowed cells). C. A comparison population of widely dispersed red GAD67-identified GABA cells in the same layer with 5-HT2CR co-expression (see yellowed cells with arrows in the end photo). The first and middle photos show each antibody separately (see same arrowed cells). Abbreviations and confocal microscopy, see Fig 2 & 3. Scale bar = 20 µm.

