Fig. 1.

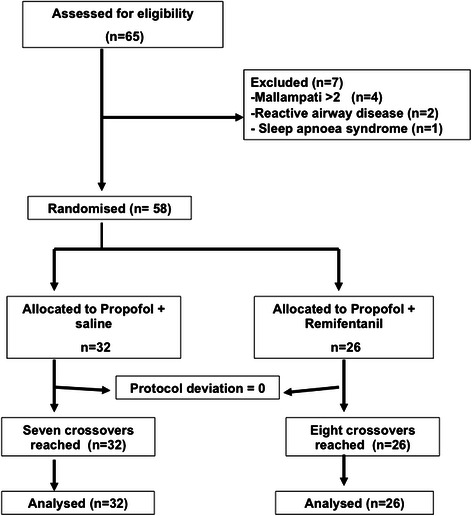
Flow-diagram of patient progress through the phases of the trial. Patients were recruited until a sample size of seven crossovers was reached in each group

Flow-diagram of patient progress through the phases of the trial. Patients were recruited until a sample size of seven crossovers was reached in each group