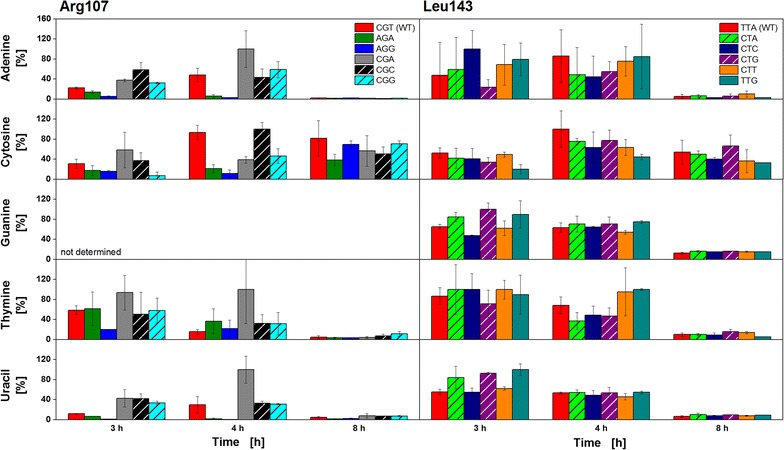
Fig. 3.

Relative changes in intracellular nucleobases during initial growth and production phases. Time-dependent changes in free nucleobases within the cells presented for six clones varying in Arg107 codons (left) and six clones varying in Leu143 codons (right) as relative intensities in [%]. At the indicated time points, the cells were collected, their metabolites extracted, and the nucleobases were analyzed by LC/MS. Clones categorized into Type A respiration behavior are presented with fully filled bars, Type B clones are indicated with striped bars. The three chosen time points represent initial growth on glucose (3 h) and glycerol (4 h), and recombinant protein production on lactose (8 h). All data points are the mean of triplicate measurements. The error bars represent the standard deviation
