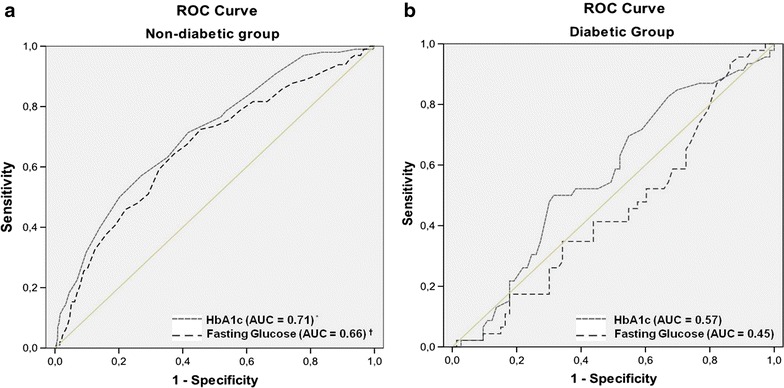
Fig. 2.

Area under the ROC curve (AUC)—a (non-diabetic group) and b (diabetic group). Comparison of discriminatory powers of HbA1c and fasting glucose in the risk assessment for increased between diabetic and non-diabetic group. *AUC of HbA1c in the non-diabetic vs the diabetic group (p = 0.02). †AUC of fasting glucose in the non- diabetic vs the diabetic group (p = 0.0007)
