
Fig. 2.
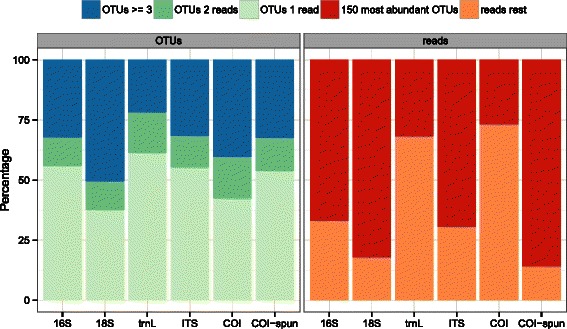
Relative proportion of OTUs at 97 % clustering threshold inferred by read count for molecular datasets. Left panel: Percentage of OTUs having 1 read (‘OTUs 1 read’), 2 reads (‘OTUs 2 reads’), and 3 or greater reads (‘OTUs ≥3’). Right panel: Percentage of reads in the most abundant 150 OTUs (‘150 most abundant OTUs’), compared to all remaining reads ‘reads rest’)