
Fig. 4.
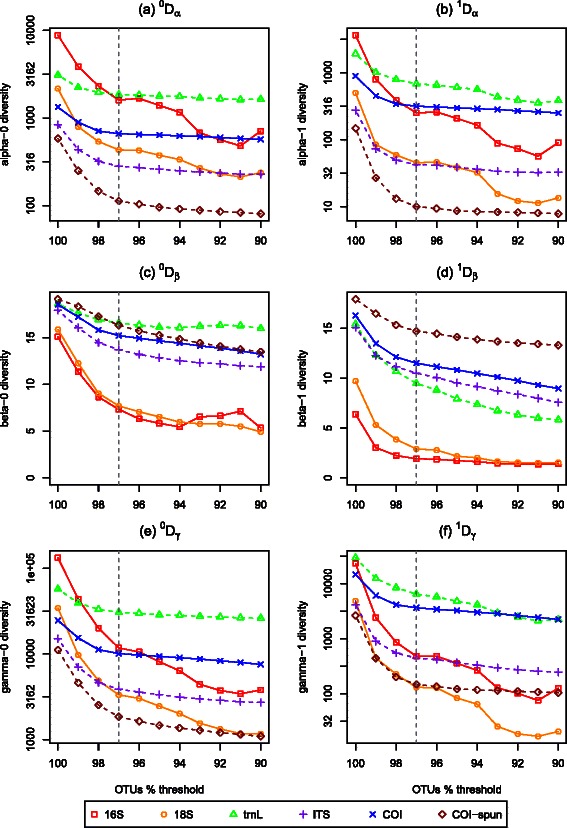
Plots of diversities using cutoff thresholds ranging from 90–100 % for OTU classification of a α diversity, b effective α diversity, c β diversity, d effective β diversity, e γ diversity, and f effective γ diversity. Molecular datasets include 16S, 18S, trnL, ITS, COI, and COI-spun