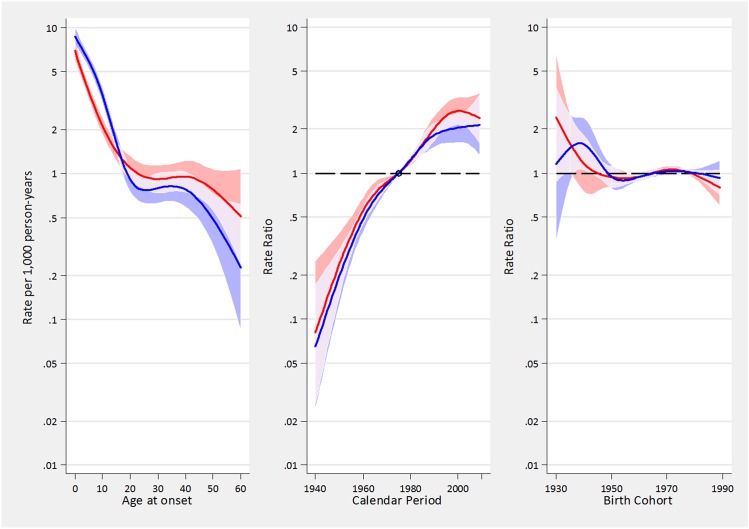
Fig 3. A-C. Estimated effects from the APC models for asthma incidence rates in males (blue tonalities) and females (red tonalities).
Fig 3A represents the age-specific incidence rates, referred to the reference period 1975; Fig 3B represents the merged period and drift effects (rate ratios), with linear increasing trend determined by the drift, and deviations from linearity (curvature) determined by the period effect; Fig 3C represents the birth cohort effect. The respective regions surrounding the lines provide the 95% confidence intervals (95%CI). Overlapping 95%CI are highlighted with lighter areas.

