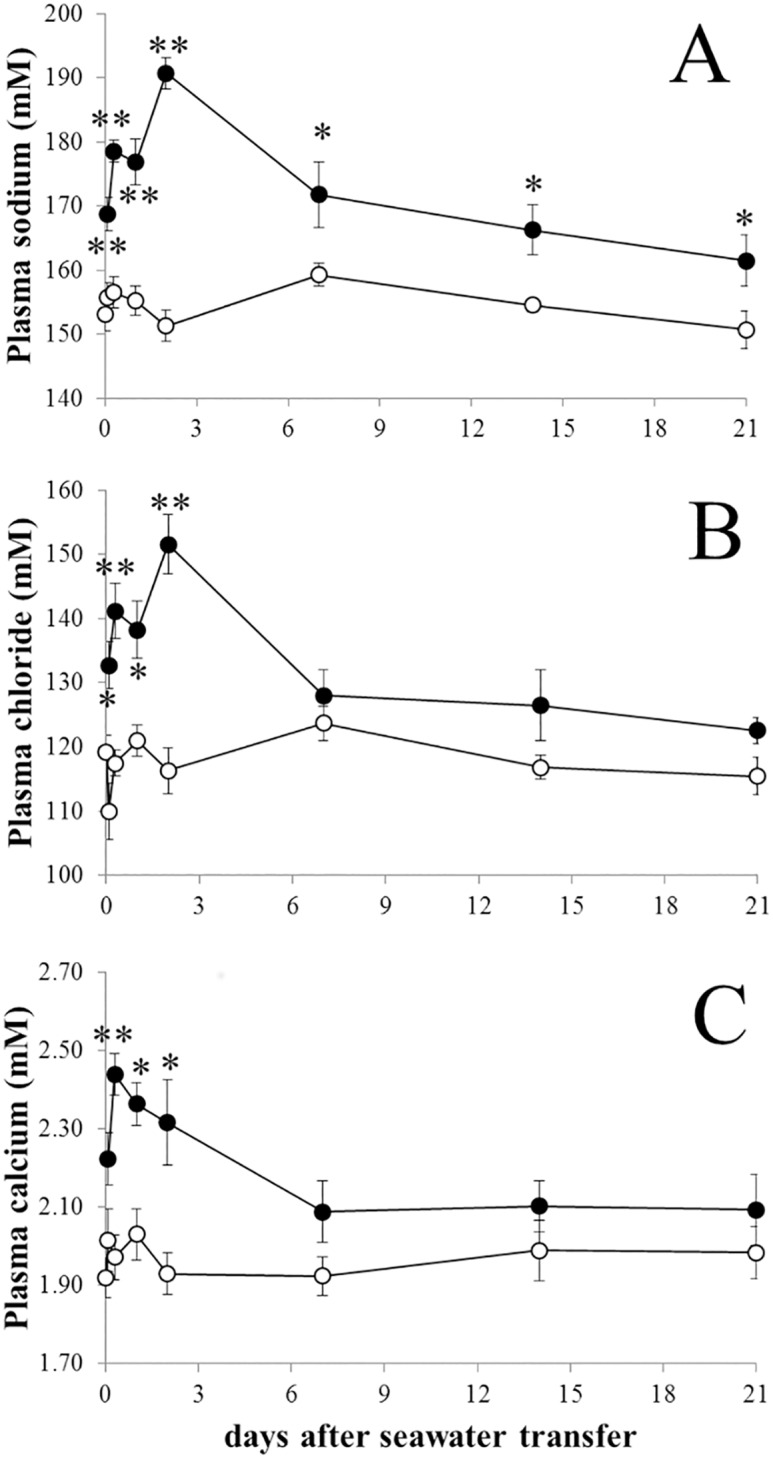
Fig 1. Plasma ion concentrations after sea water transfer.

Mean plasma sodium (A), chloride (B), and calcium (C) from time 0 to 21 days post sea water transfer. Open and filled circles represent respectively freshwater and seawater transferred trout. Values represent means ± s.e.m. of six fishes. Differences between freshwater and seawater at each time point were assessed with non-parametric Mann-Whitney U-test after non-parametric analysis of variance (Kruskal-Wallis test). * and **, significantly different from the corresponding values in freshwater at P<0.05 and P<0.01.
