
Figure 4.
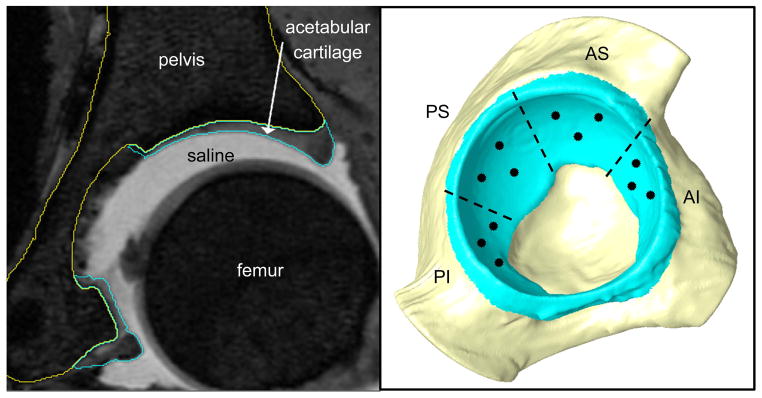
Sample DESS image with three-dimensional reconstruction. Left panel-mid-joint coronal slice of DESS MRI with bone, cartilage, and saline clearly visualized. The acetabular cortex and cartilage automatically defined segmentation masks are outlined in yellow and blue, respectively. Right panel-lateral view of surface reconstruction of acetabular cortex and cartilage with posteroinferior (PI), posterosuperior (PS), anterosuperior (AS), anteroinferior (AI) regions identified and approximate locations of cartilage cores shown. Page Width, Color.