
Fig. 2.
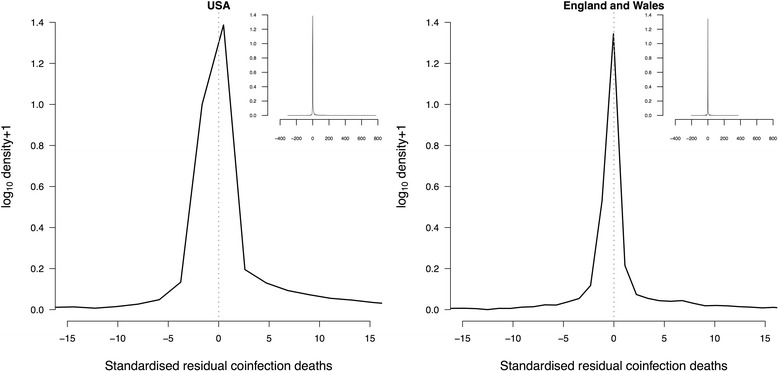
Distribution of association of pairs of infections on death certificates in the USA (left) and England and Wales (right). Solid black lines are the density curves of standardised residuals for the number of co-infection deaths from Chi-squared tests. Vertical dashed grey line at zero residual. Inset shows the whole distribution