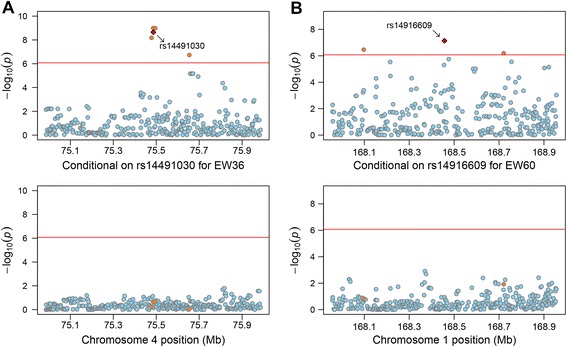
Fig. 2.

Regional association plots of two loci associated with EWs at 36 and 60 week of age (EW36 and EW60). For each plot, the -log10 (observed P-values) of SNPs (y-axis) are presented according to their chromosomal positions (x-axis). The horizontal red line depicts the genome-wide significance level (8.43 × 10⁻⁷). The significant SNP after univariate, multivariate and conditional GWASs is represented by a red diamond and is labeled by its rs number. a Regional association results for EW36 before (upper) and after (lower) conditioning on rs14491030. b Regional association results for EW60 before (upper) and after (lower) conditioning on rs14916609
