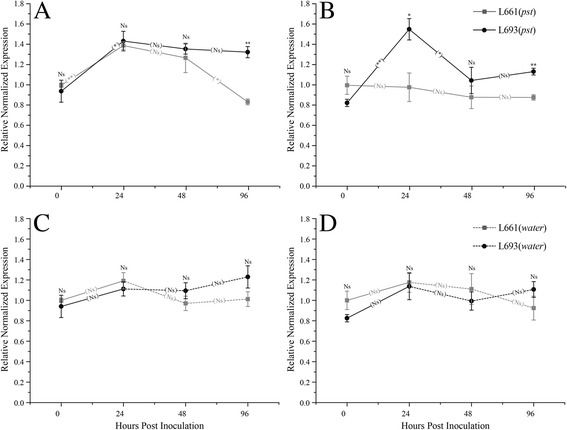
Fig. 6.

qRT-PCR expression analysis of WCBP1 and WCBP2. Amplification of WCBP1 (a) and WCBP2 (b) transcripts following Pst infection. C, Amplification of WCBP1 (c) and WCBP2 (d) transcripts following mock inoculation with water. The experiment was performed using three biological replicates with three technical replicates per biological sample. Relative expression was calculated using GAPDH as a reference gene to infer steady-state mRNA levels, and relative expression was normalized by setting the control sample from L661 at 0 h to 1. Bars represent the standard error, and the significance was determined using independent sample t-tests. Asterisks represent significant differences as follows: **P ≤0.01, *P ≤0.05; Ns, no significant difference. The raised asterisks or the Ns designation represent differences in gene expression between L693 and L661 at each time point. Asterisks or the Ns designation in the trend line represent the differences in gene expression between two adjacent time points in the same genotype
