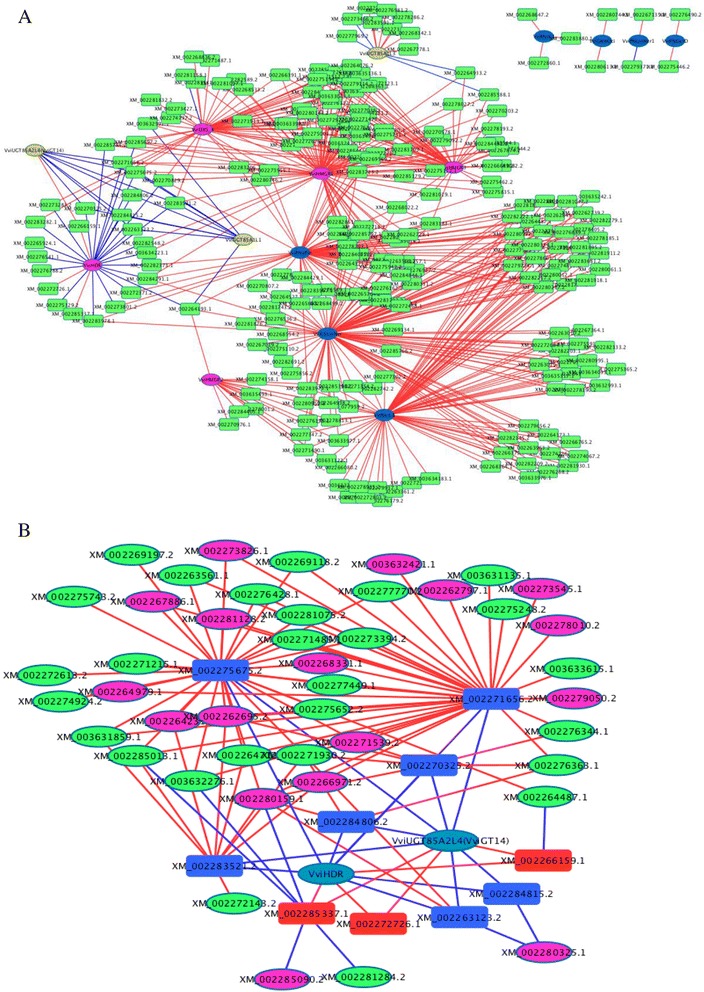
Fig. 8.

a Co-expression network analysis for the differentially-expressed structural genes and candidate transcription factor (TF) genes. The TFs listed in the plot have a high correlation coefficient (≥|0.8|) with structural genes in terms of transcript accumulation. Structure genes are represented as circle nodes. Different colors are used for the various gene categories: pink for genes in terpene precursory pathway, blue for terpene synthase genes, yellow for glucotransferase genes. TFs are represented as rectangle nodes, and TF gene ID is shown in the tectangle. The annotation of all genes and TFs in this network is listed in Additional file 1: Table S6. b Co-expression network analysis for structural genes, candidate TF genes and ripening-associated genes. In this network, structural genes were VviHDR and VviUGT85A2L4 (VviGT14) that potentially dominate differential accumulation of terpenes in the grapes between the GT and CL regions; TFs in plot B are those that positively (in red rectangle) and negatively (in blue rectangle) co-expressed with both VviHDR and VviUGT85A2L4 (VviGT14); the ripening-associated genes listed in plot B have over 0.8 of the correlation coefficient absolute value with TF genes in terms of transcript accumulation. Pink oval indicates the genes related to ABA biosynthesis and signal transduction, and green oval represents the genes related to ethylene biosynthesis and signal transduction. In plots A and B, lines connecting two nodes represent significant correlation: red means a positive correlation and blue means a negative correction
