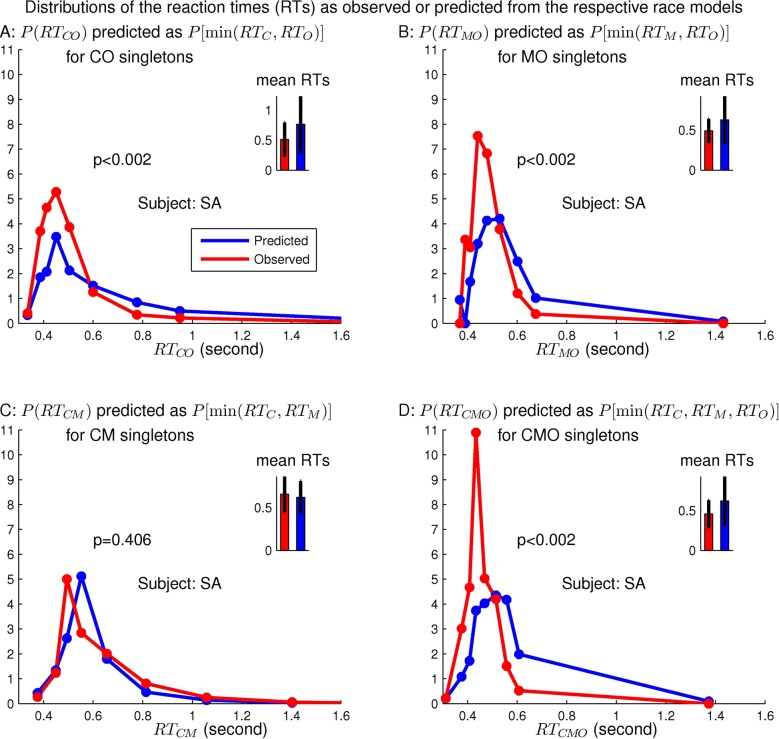
Fig 5. The observed and predicted distributions of reaction times for a double- or triple-feature singleton, using four different race models (race equalities), (in panel A), (in panel B), (in panel C), or (in panel D), in a race between the corresponding racers whose reaction times are those of the corresponding single-feature singletons.
The data are from the same subject SA already shown in Fig 3, panel A shows the same information as that in the bottom panel of Fig 3. The predicted and observed distributions are significantly different from each other except in panel C.

