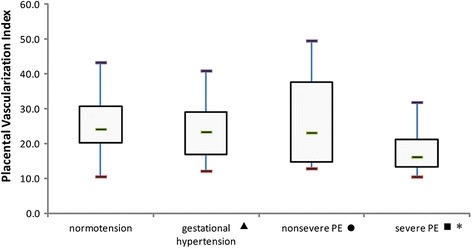
Fig. 2.

The placental VI in different population subgroups. The horizontal bar within each box corresponds to the median. The upper and lower bars of each box correspond to the first and third quartiles, respectively. The vertical whiskers outside each box extend to the smallest and largest observations within a 1.5 interquartile range (third-first quartiles). The symbols of ▲, ● and ■ represented the comparisons of parameters between normal group and gestational hypertension, normal group and nonsevere PE, normal group and severe PE. * represented a significant difference. PE = preeclampsia. For placental VI, P values of ▲, ● and ■ were 0.32, 0.61 and <0.001, respectively
