
Fig 4. Percentage of trials in which children of each age group succeeded at placing the stick into the cut-out or onto the form on the disc.
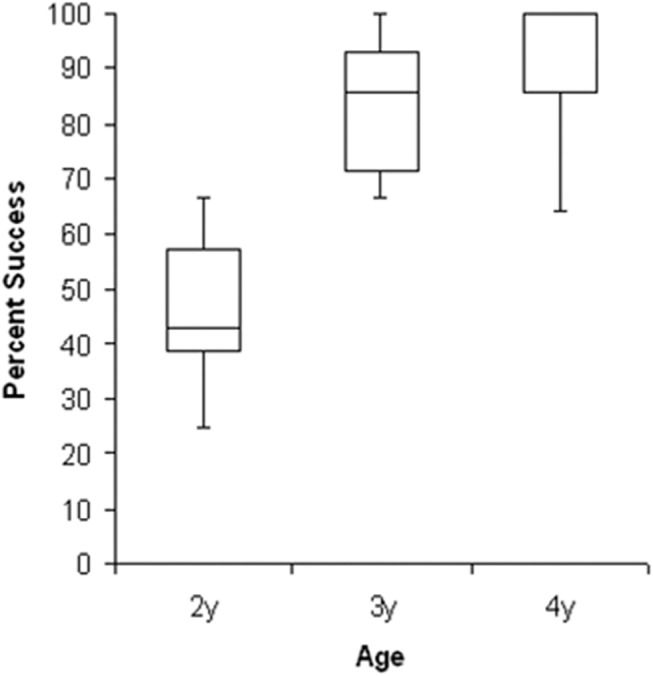
Boxes represent interquartile range (IQR), with median in the middle. Upper whiskers depict the lower of maximum data point or 1.5 x IQR. Lower whiskers depict the higher of minimum data point or 1.5 x IQR. Most extreme outlier beyond each whisker is shown by *.