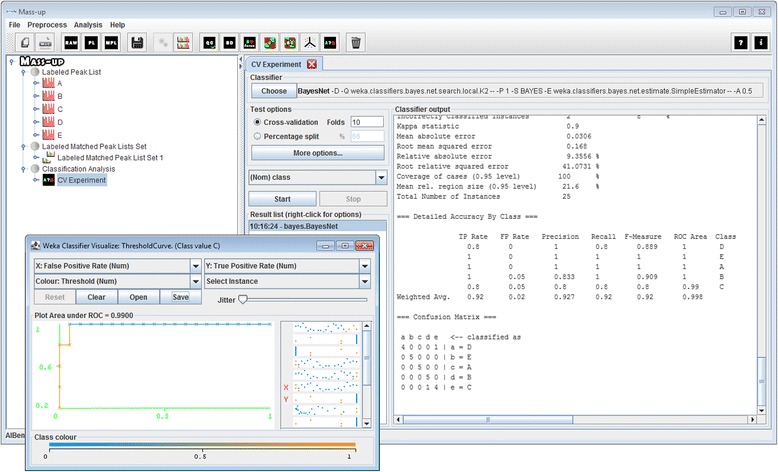
Fig. 5.

Classification analysis view. Classification analysis view presenting the result of executing a Bayes Net classifier using a 10-fold cross validation scheme. The resulting confusion matrix is presented along with several statistical measurements. ROC curve corresponding to condition C of the Wine dataset is also showed
