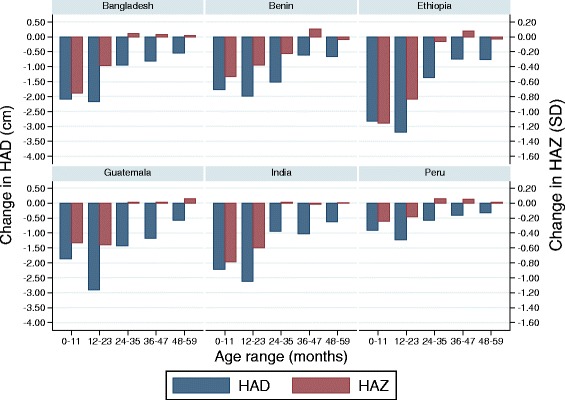
Fig. 3.

Changes in height-for-age Z-score and height-for-age difference. Mean changes in height-for-age z-scores (red) and height-for-age difference (blue) by year for 6 DHS surveys (1 to 59 months) (n ranges from 3860 to 41,327)

Changes in height-for-age Z-score and height-for-age difference. Mean changes in height-for-age z-scores (red) and height-for-age difference (blue) by year for 6 DHS surveys (1 to 59 months) (n ranges from 3860 to 41,327)