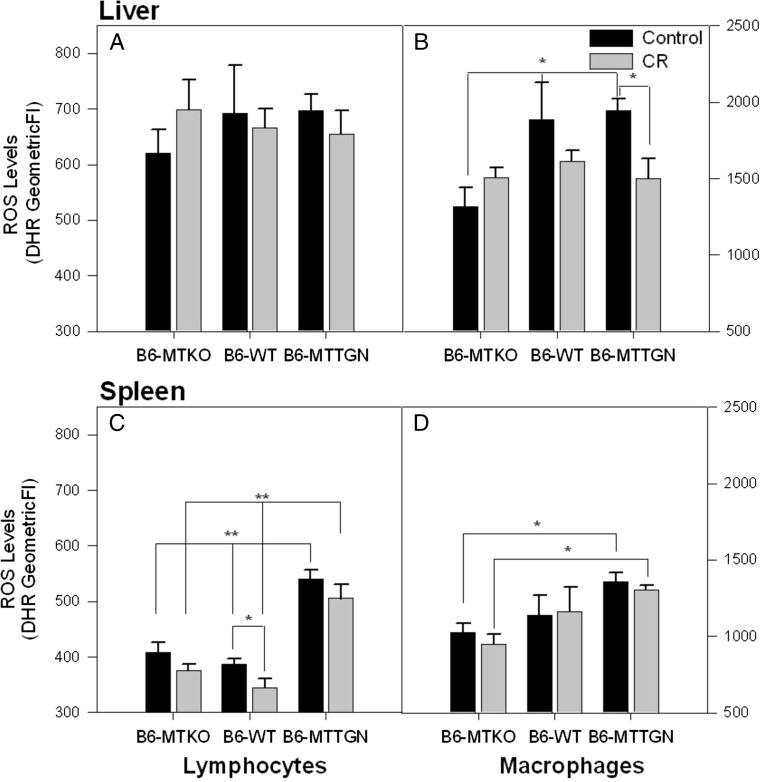
Fig. 4.
ROS levels in Kupfer cells and splenic lymphocytes and macrophages are altered by MT gene dose and CR stress treatment. On day 3 post inoculation, hepatic leukocytes (a Lymphocytes and b Kupffer cells) and splenocytes (c Lymphocytes and d macrophages) were tested for reactive oxygen species (ROS) levels (n = 3 per group). ROS was measured by levels of oxidized dihydrorhodamine 123 (DHR-123). Statistical comparisons of ROS levels between strains were analyzed by ANOVA. Comparisons between treatment groups within each strain were measured by t tests. Error bars represent the standard error of the geometric mean of the fluorescent intensity (GeomeanFI), *p < 0.05 and **p < 0.001

