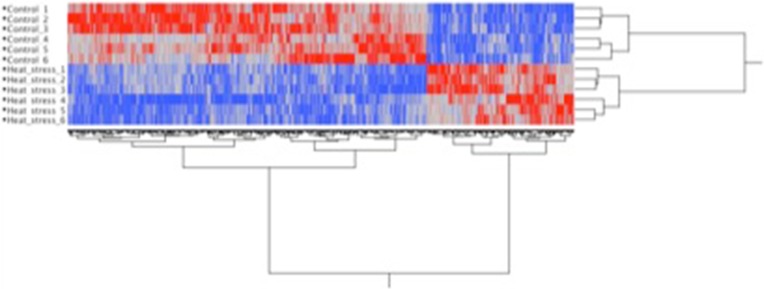
Fig. 1.
Hierarchical clustering Hierarchical cluster analysis of transcriptome data from heat challenged and control cells. Note that the control and heat stress samples cluster separately. Red corresponds to genes whose transcripts were enriched in the corresponding sample while blue corresponds to genes whose transcripts were reduced in that sample.

