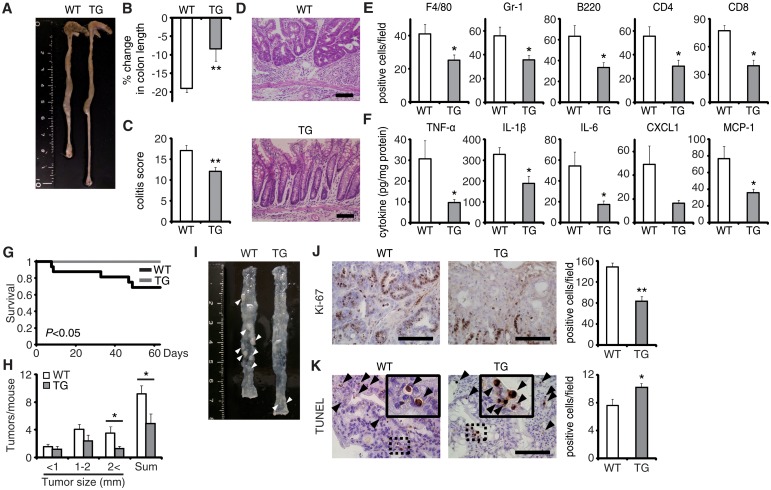
Fig 5. EPRAP overexpression in macrophages ameliorates DSS-induced colitis and colitis-associated tumorigenesis.
(A) Representative photographs of colons at the end of DSS treatment; colons were obtained from WT and CD68–mEPRAP transgenic (TG) mice. (B) Percent changes in colon length expressed relative to DSS-free water controls (n = 8 [WT]; n = 6 [TG]). (C) Histological colitis scores (n = 10 [WT]; n = 8 [TG]). (D) Representative H&E staining of rectal sections. (E) The numbers of F4/80-, Gr-1–, B220-, CD4-, and CD8-positive cells infiltrated in colonic tissues of WT and TG mice, per high-power field (400× magnification) (n = 8 each). (F) The expression levels of TNF-α, IL-1β, IL-6, CXCL1, and MCP-1 protein in colonic tissue lysates from DSS-treated WT and TG mice (n = 15 [WT]; n = 8 [TG]). (G) Survival curves during the course of AOM/DSS treatment in WT and TG mice (n = 18 [WT]; n = 11 [TG]; P < 0.05). (H) The numbers of colonic polyps per mouse, with size distribution (left) and total number (right) in colonic tissues of AOM/DSS-treated WT and TG mice (n = 9 [WT]; n = 10 [TG]). (I) Representative photographs of colons at the end of AOM/DSS treatment. (J) Ki-67–positive cells in rectal polyps of AOM/DSS-treated WT and TG mice (left). TG mice exhibited markedly fewer Ki-67–positive cells than WT mice (n = 5 each) (right). (K) Representative photographs of TUNEL assay performed on rectal polyps of AOM/DSS-treated WT and TG mice. The arrows indicate TUNEL-positive apoptotic cells: the insets show higher magnifications of selected regions (indicated by dashed boxes) (left). TG mice exhibited more TUNEL-positive cells than WT mice (right) (n = 5 each). All values represent means ± SEM. *P < 0.05, **P < 0.01 vs. WT mice. Scale bars: 100 μm.

