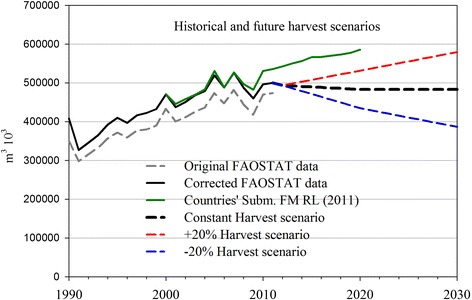
Figure 2.

Total harvest demand: total harvest demand (in m 3 10 3 ) for 28 EU countries, based on the historical FAO statistics (until 2012, Original FAOSTAT data) corrected to account for possible under-/over-estimates (Corrected FAOSTAT data used in this paper, see Table 1 ) and three future harvest scenarios: constant harvest, increasing harvest (+20%) and decreasing harvest (−20%) up to 2030. A comparison with the harvest provided by countries's Submission FMRL is also reported.
